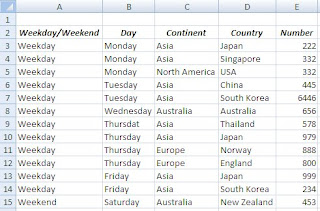
- I create the excel table as the example as shown in this figure.
- Then, I select the cell that I want to create the Pivot Table for example, G2.
- Go to Insert tab->PivotTable->PivotTable.
- The CreatePivotTable window appears, then you select all the cells of your information that you want to create the Pivot Table. Then, the Range shows in the textbox. Moreover, you can select the Table if you're already name your table.
- Click OK.
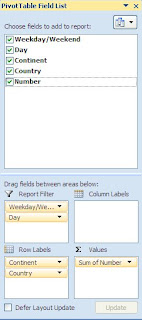
- The PivotTable Field List appears in the right zone. You can drag the fields into the below bottom which are Report Filter, Column Labels, Row Labels, Values. You can manage your Pivot Table to make it useful for your analysis. I managed my Pivot Table as shown in the following figure.
- Then, I got my Pivot Table.


No comments:
Post a Comment